
Create Parent-Child Hierarchies
In parent-child hierarchies, you use a parent attribute that determines the relationship among the view attributes. Parent-child hierarchies have elements of the same type and do not contain named levels.
Context
Parent-child hierarchies are value-based hierarchies, and you create a parent-child hierarchy from a single parent attribute. You can also define multiple parent-child pairs to support the compound node IDs.
For example, you can create a compound parent-child hierarchy that uniquely identifies cost centers with the following two parent-child pairs:
· CostCenter and ParentCostCenter and
· ControllingArea and ParentControllingArea,
A parent-child hierarchy is always based on two table columns and these columns define the hierarchical relationships amongst its elements.
Others examples of parent-child hierarchies are bill of materials hierarchy (parent and child) or employee master (employee and manager) hierarchy.
Example:
Here I used two tables named as PC_HIER_EMP_DETAILS and PC_HIER_MANAGER to create a parent-child hierarchy.
Procedure:
Step 1: Create an Attribute view for PC_HIER_MANAGER by right click the Package and select New and choose Attribute View.
Step 2: And Provide Name and Label Details which are required and Click Finish.


Step 3: Drag and Drop the required tables and select required field.
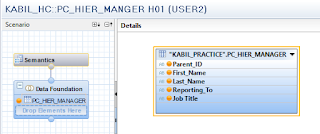

Step 4: Click semantics and select Hierarchy tab and select Create Icon. A pop-up will appear and provide details as shown as below:
Hierarchy type : Parent-Child Hierarchy
Child Node : Parent_Id
Parent Node : Reporting_To

Step 5: Click OK. And validate and Activate the view.
Step 6: Then create an Analytic view by right click the Package and select New and choose Attribute View.
Step 7: And Provide Name and Label Details which are required and Click Finish.
Step 8: Drag and Drop the required tables and select required field. Here I used the above-created attribute view and one fact table named as PC_HIER_EMP_DETAILS.

Drag a
Projection Node: Drag and Drop PC_HIER_EMP_DETAILS
table and select required fields.

Star Join
Node:

Step 9: And make a link between the Attribute view and the fact table in a Star Join based on their relationship. In a Semantic, hierarchy tab we can see the Hierarchy which we created in an Attribute view.
Step 10: Then validate and Activate the view.
In an Excel:
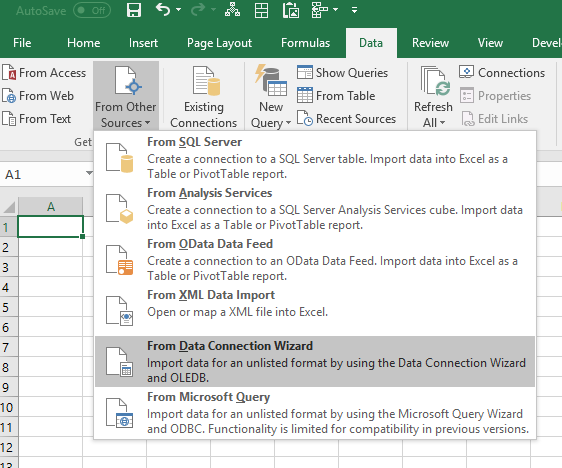
Step 1: Open Excel and Click “Data” tab and select “From Other Sources” and Choose “From Data Connection Wizard”.
Step 2: A Pop-up will appear. And choose “Other/Advanced” and Click “Next”.

Step 3: A Pop-up will appear “Data Link properties” select “SAP HANA MDX Provider” and Click Ok. A Pop-up window will appear as shown as below and provide required details. And click “Ok”.

Step 4: A pop-up window will appear from this select your view which contains hierarchy. Here I choose “AN_PC_HIER_EMP_MANAGER”. And click “Next”.

Step 5: Click “Finish”.
Step 6: Another “Import Data” pop-up will appear to select how we want to view our data from this select “Pivot table Report” and click “Ok”.

Result:
From the Pivot table Fields: select the field based on your requirement:
Here I choose following fields:
- PC_HIER_STRUCTURE
- First_Name
- Salary


